
We’re excited to announce the launch of Sensible’s in-app dashboard. Now, you can track all your document extraction metrics in one place, in real-time. Easily aggregate performance summaries, monitor configuration success, track usage at the document type level, and view historic performance data for all production deployments.
The dashboard includes the new extraction coverage metric, which measures the percent of fields successfully captured without errors out of all extractable ones. Expected extraction coverage scores vary by use case – in some cases it may be 100%, but in most it will be less. For example, tax forms often have blank fields, making their expected average extraction coverage much less than 100%.
Explore your own extraction data in the Sensible app, or continue reading to learn more about the dashboard components.
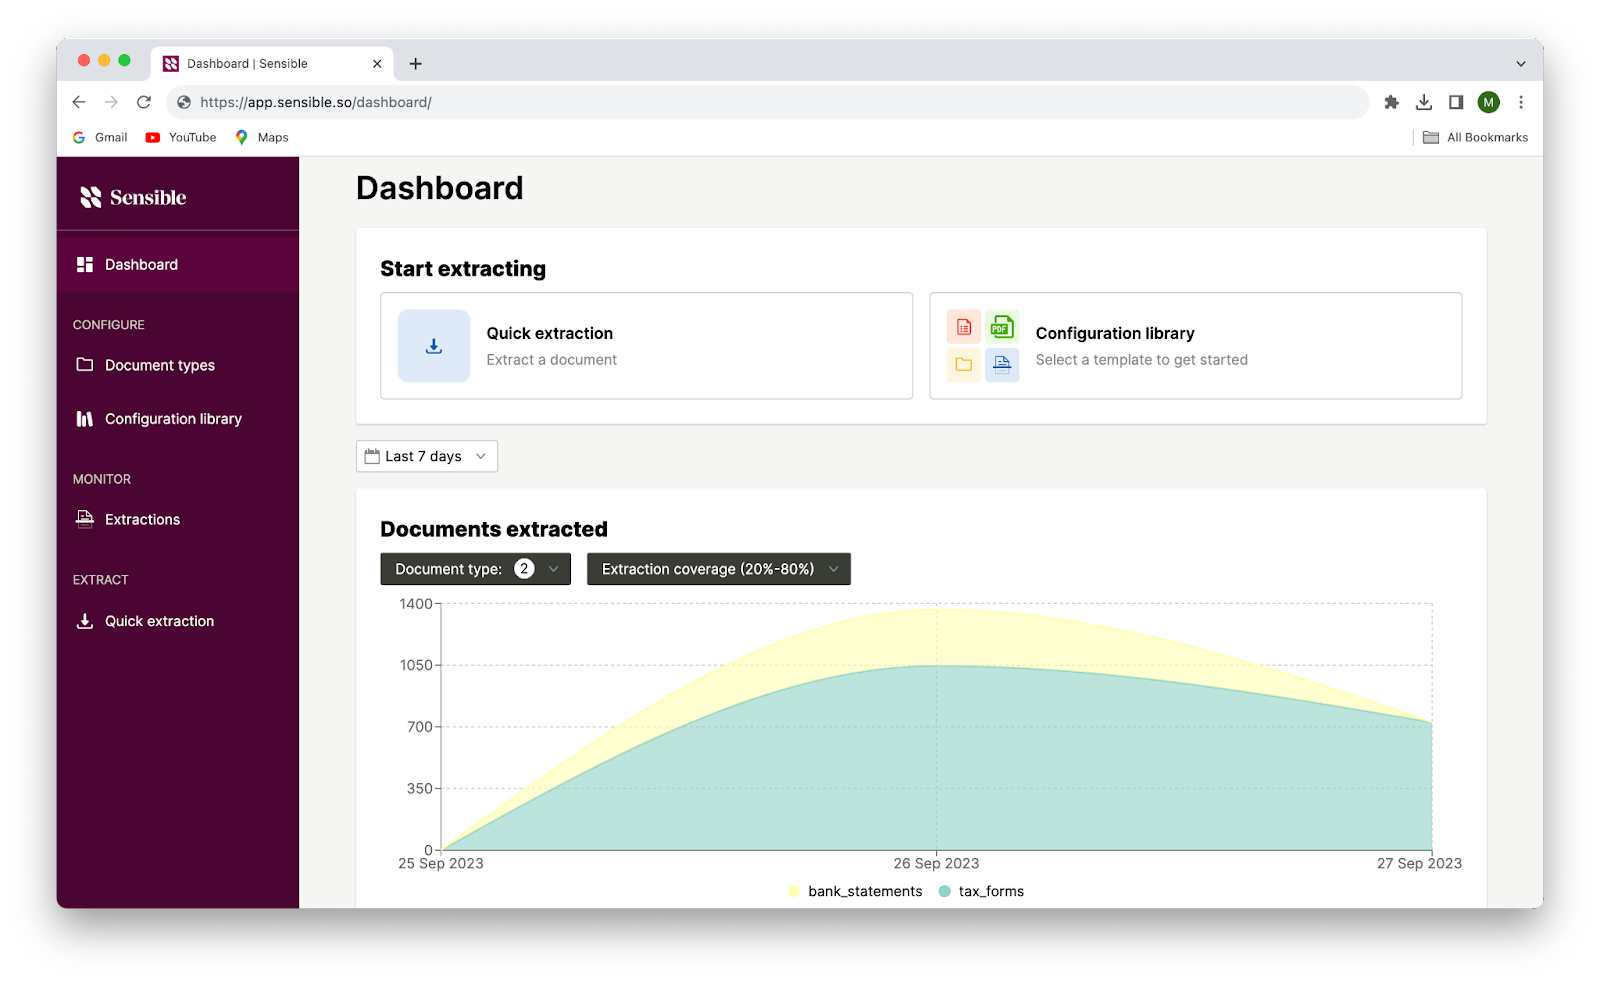
Track extraction API call volume by document type and extraction coverage
Use the extraction API graph to track the total number of extractions completed in a given timeframe. Filter by document type to compare usage and volume fluctuations, or by extraction coverage score to track performance.
Monitor extraction coverage to find configurations that need improvement
Gauge configuration performance across extractions. The coverage table for configurations aggregates individual extraction coverage scores. It also includes the percentage of extractions for a given configuration that fall within your defined extraction coverage threshold.

Use the table to identify low-performing configurations that need to be updated.
Compare configuration usage
The most used configuration table shows the configuration frequency as a percentage of total extractions. You can also filter by document type.
Monitor the performance of recent extractions
Filter and sort by extraction date, configuration name, document type, ID, or coverage score to compare extraction performance with the recent extractions table. Use it to identify configurations that are failing, or working as intended, for quick troubleshooting before your workflows are impacted.
Start tracking your document extraction in real-time with the new Sensible dashboard. Try it today in your Sensible account, or request a demo from a Sensible expert.

.png)
